John Haldeman - Visualizations
Home | Projects | Visualizations | Presentations | BlogSome of my favourite visualizations that I've built. You can find many more on my Observable page.
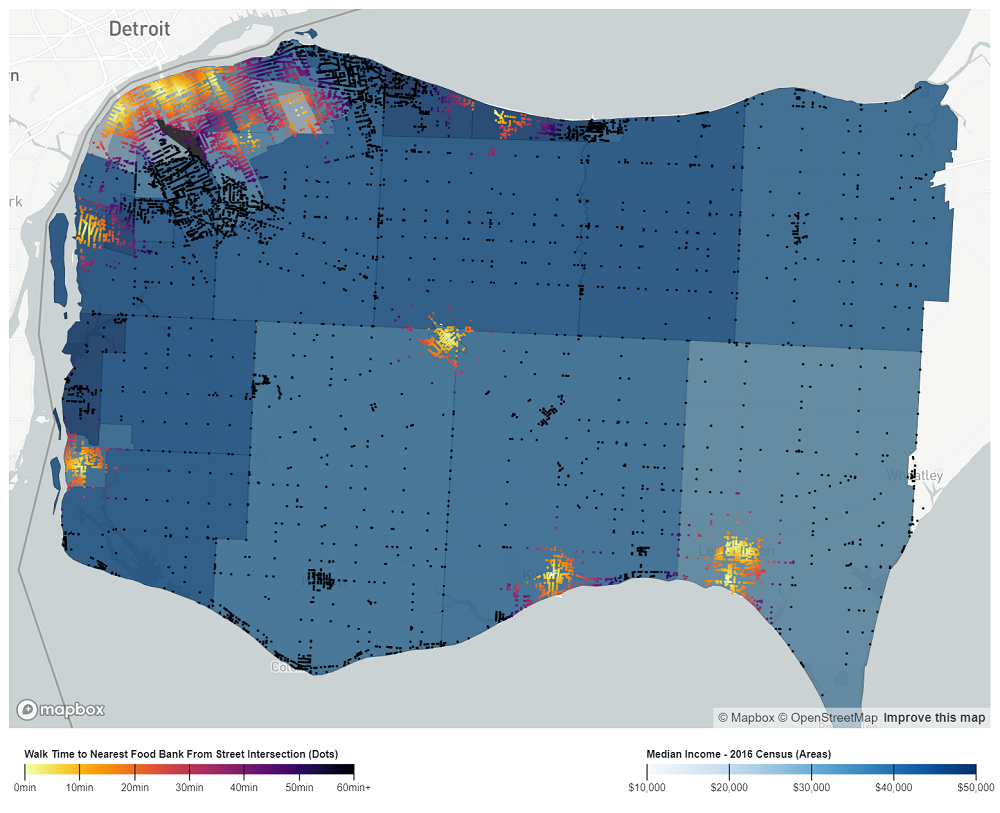 | A notebook showing walk times from every intersection and census tract median income in Windsor-Essex to the nearest
food bank open during the COVID-19 outbreak. Uses DeckGL. Intersections from Open Street Maps' Overpass API. Website |
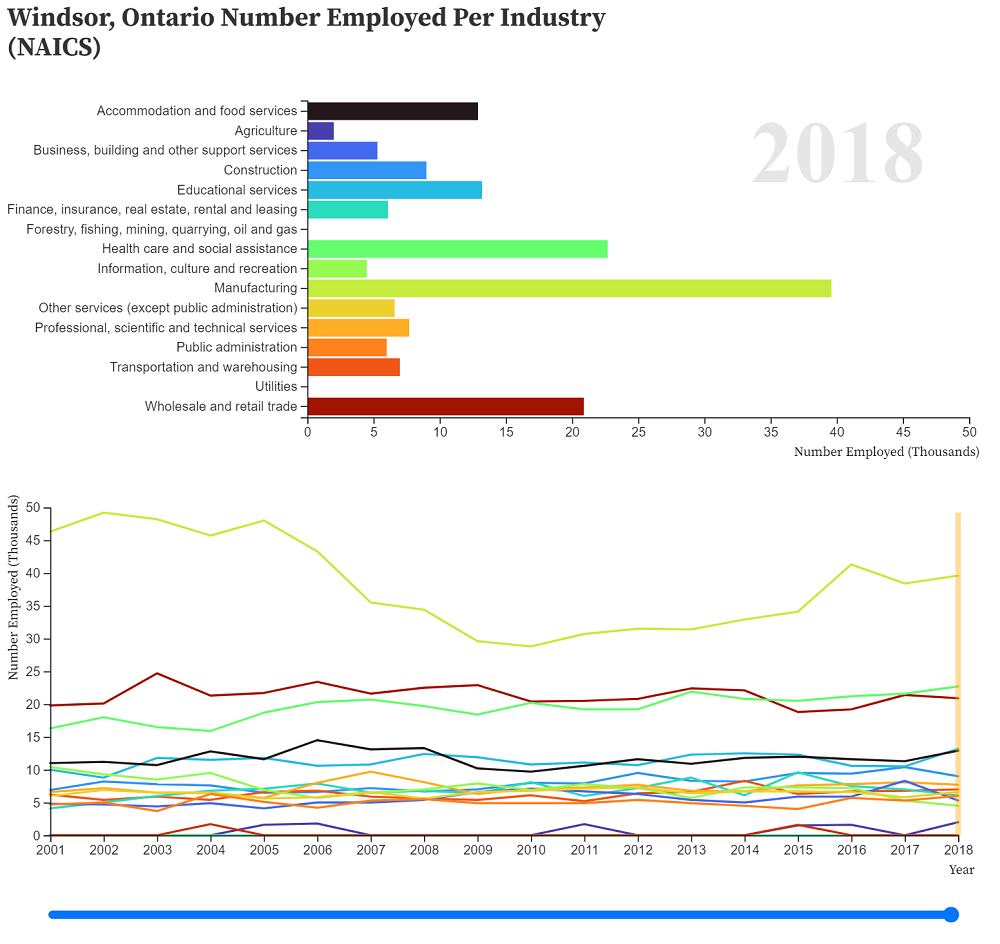 | A notebook showing industry employment for a selectable CMA in Canada in two ways - a bar chart and line chart. The bar
chart and line chart mirror eachother as time progresses or interacted with by the user. Built with D3. Website |
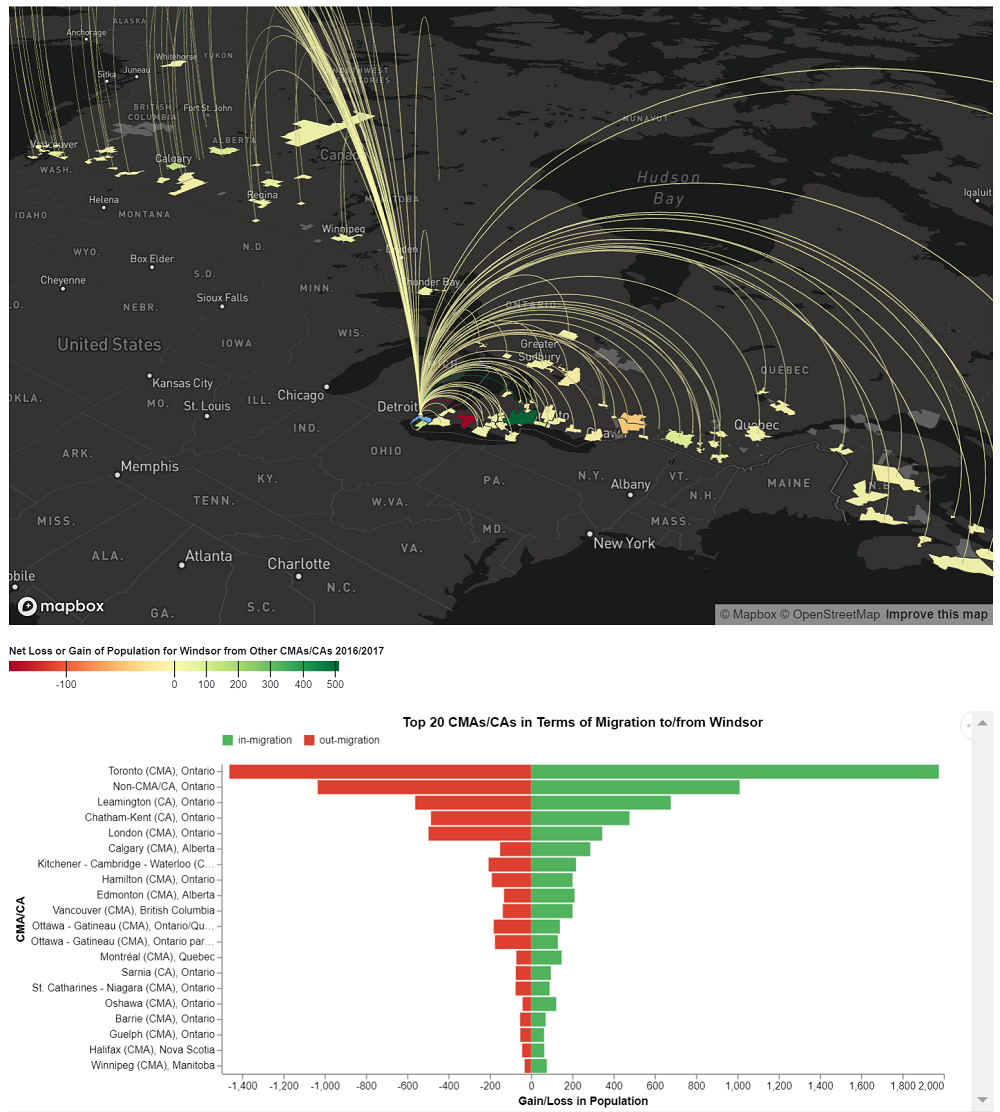 | A notebook cross CMA migrations for Canadian cities. It is interaction and shows the migration numbers in two ways, a map and
pyramid chart. When you change the CMA/CA by clicking on the map the chart and the map track eacother. Built with DeckGL and D3. Website |
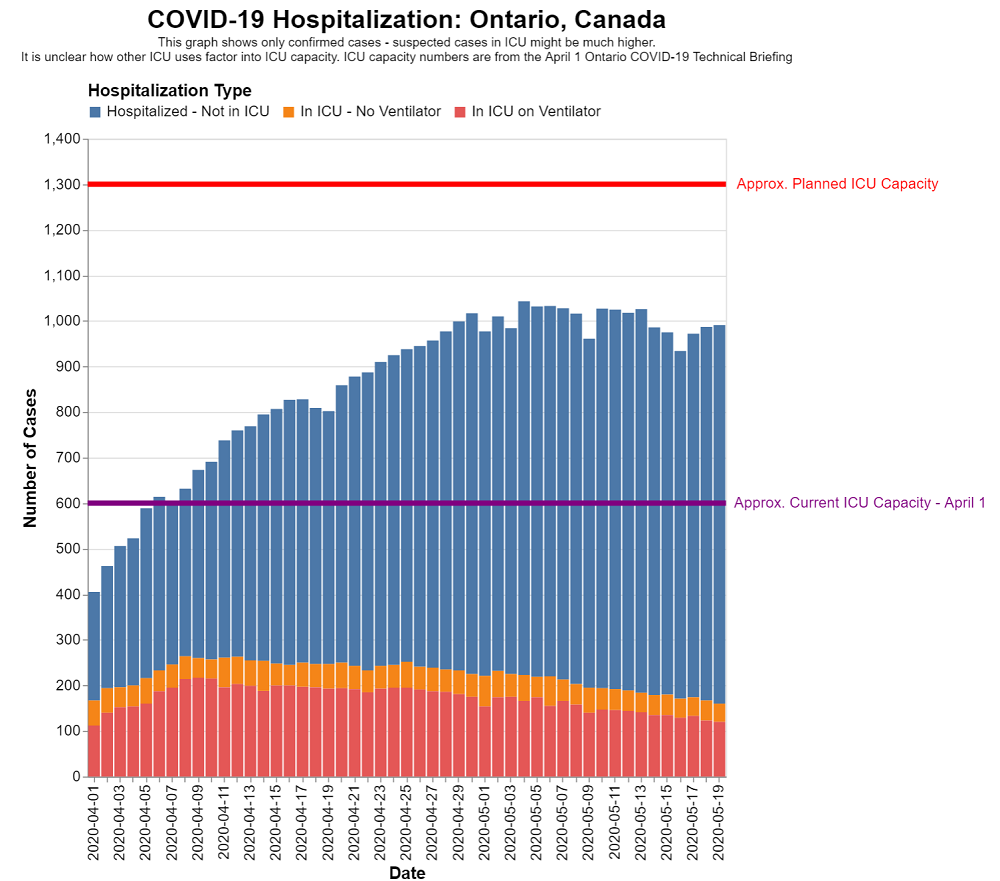 | A notebook showing various statistics on COVID-19 testing and hospitalization in Ontario. All graphs shown and built with
Vega Lite. Website |